
It goes without saying that successful breweries need to do more than just make great beer, they also need to turn a profit.
With increasingly intense competition in the craft brewing industry, the line between brewing as an art and an exact science is getting, well, hazy. Margins of error are smaller, time is money, and opportunities must be seized.
By adopting an analytical approach toward the brewing process, breweries of all sizes are increasing their bottom line, as well as improving efficiency, quality—and consistency of their beer.
But what does taking an analytical approach toward the brewing process mean—and how does it make a difference in all brewery operations?
From tracking data, to analytical assessment, to performance indicators—let’s explore how data and brewery analytics can be used for your KPIs and success metrics, to help boost your bottom line.
Brewery Analytics: Collect, Transform, Predict
Many of us track data, but when asked why we do it, most of us hear phrases like “we’re supposed to track data” or “that’s just the way we’ve done it”.
So before we jump into how you can use data for your brewery, let’s identify why we do it and why it’s important.
There are 3 steps to brewery analytics:
1. Collection (raw data)
2. Transformation (visual representation)
3. Prediction (inferences)
Step 1 - Collection, is gathering data.
The tracked data points are the foundation for the next steps. Good data is crucial—without it, the steps that follow are more difficult. Having poor data tracking practices that lead to bad data points will have negative consequences, such as false-positive inferences, and potential data that can falsely seem unrelated.
Step 2 - Transformation, is organizing the tracked data.
Organizing data into rows and columns is helpful, but the real power comes in proper visual representation. By building charts and graphs with the data, we absorb and understand the information in front of us much faster. In fact, the human brain processes images 60,000 times faster than text, and 90 percent of information transmitted to the brain is visual. Charting and graphing this data is called descriptive analysis, and provides insight on past events.
Step 3 - Prediction, is using organized data to assume the outcome of future events.
This is taking patterns and other meaningful information gathered from the analysis of data, and making inferences to predict future events. This becomes critical to understanding how your next beers will turn out, just based on past data.
In the world of brewery analytics, the more tracked data that is available, coupled with proper organization, provide deeper insights into various aspects of the brewing process as well as its results.

Using Beer30 at Pals Brewing (North Platte, Nebraska) to replace paper logs in the brewhouse.
By using new technologies of grain-to-glass data management, tracked data is used to continuously improve recipes and efficiency in a brewery. Let’s compare this to the current “paper-to-digital-spreadsheet” approach.
While paper logs and spreadsheets have been used with varying degrees of success for years, to truly make the data work for brewery analytics would require hours of manual data review and analysis each day. From consistency across pH and gravity readings, to tracking areas of downtime, to understanding the actual cost per batch of beer—the more robust the calculation, the more time it will require.
If you are relying on paper logs or spreadsheets to track and record your data, you already know how incredibly time-consuming this can be, not to mention the all-too-real potential for human error during the recording process.
Don’t you think you could put your time to better use?
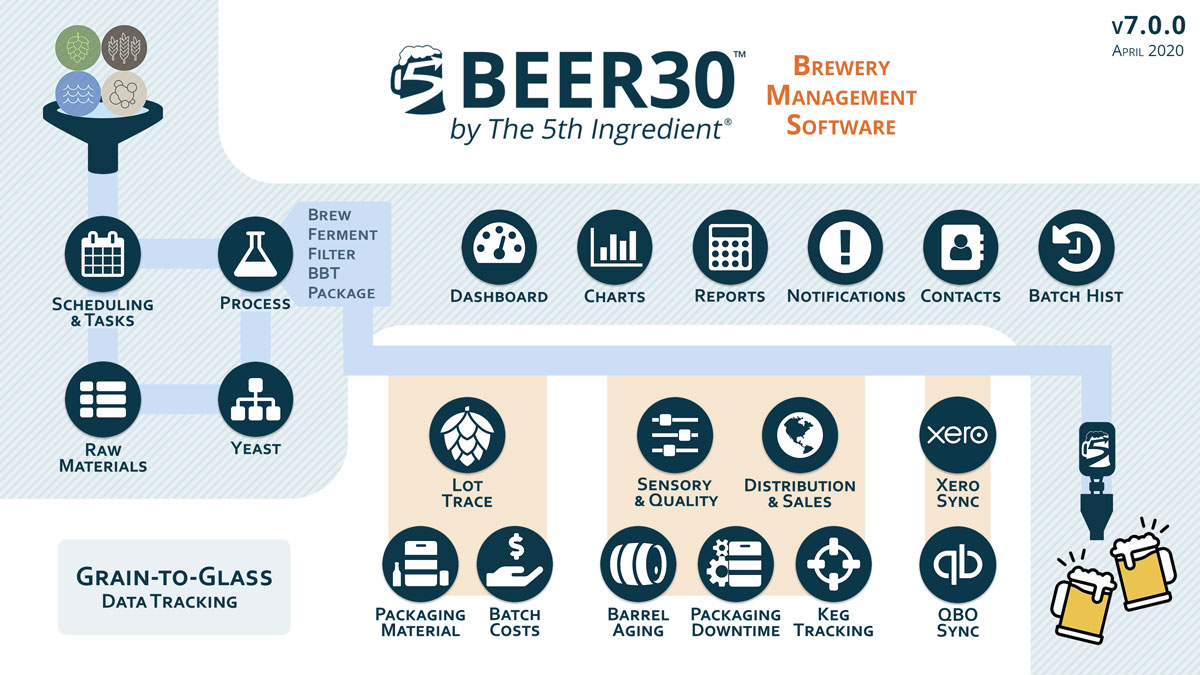
Evolution of Technology - Grain-to-Glass Tracking
Over the last few years, new advancements in technology have emerged to help breweries improve their data analysis. Our own Beer30, by The 5th Ingredient, is a grain-to-glass data management platform. It is designed to help breweries brew more and brew better. A system like Beer30 can use technology and proprietary algorithms to save the hours spent each and every day on calculating:
- process and quality data
- costs of goods and work in process
- state or government taxes
A good data management system also creates transparency within the process. This will help identify why that last batch of beer was one of the best the brewery has produced—and what steps can be taken to replicate the results. Decisions can be made to improve a beer that are based on empirical evidence, rather than anecdotes and assumptions. Mike Foran, Market Garden Brewery cofounder and COO, says of Beer30: "The process insights have empowered our entire team to be plugged in to real time data and make efficiency driven decisions to grow our business and profitability."
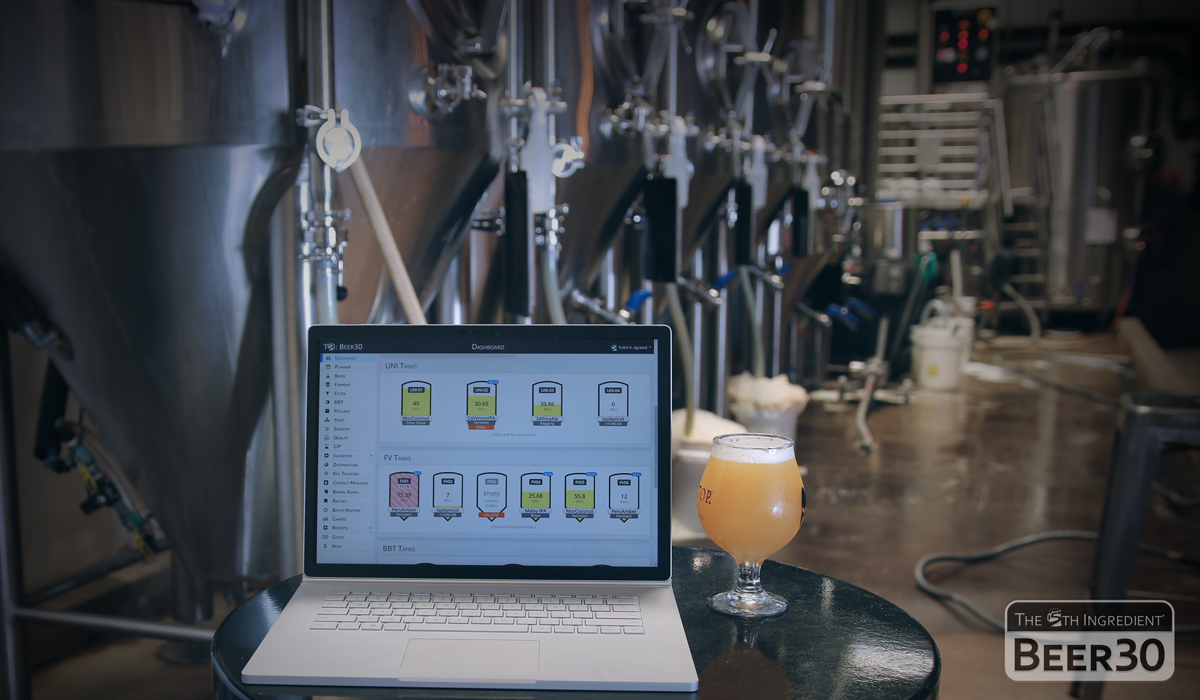
Evolution of Technology: Using Beer30 at Protector Brewery (San Diego, California).
In addition, data management software that integrates with internet-enabled sensors provide an excellent way to gain real-time visibility to trends in the status of tanks and beers, while reducing the need for manual entry of those data points.
Manually entering measurements remains the practical method for most breweries, particularly for measurements following human action. But we are seeing a rise in automation of repetitive status-based measurements (i.e., temperature of beer in the fermentation tank).
Either method is acceptable across the majority of cases—the important part is getting the data into the platform for real-time analysis.
So now that we understand more about the importance of data, what’s next? How do we use this information to make better decisions for the brewery?
Brewery Analytics: The 4Ps for Successful Data Management
With all the data that is being tracked and analyzed, we have developed the 4Ps for Successful Data Management. We share these with our clients, to help them improve their efficiencies and systems.
P1 - PROACTIVE VALIDATION
Proactive validation of your data means that instead of spending time reviewing the data after a process is completed, the data is validated in real-time as it is entered.
A magical thing happens when proactive validation is implemented successfully. Issues are recognized sooner, meaning the problem is smaller, the response time is shorter, and the solution is executed more quickly.
In many cases, issues in the brew process compound over time—growing larger and more difficult to recover from, the longer they exist. By shortening the response time we approach smaller issues and increase our probability of correcting the issue (while decreasing the probability for over-correction).
Another benefit of proactive validation is catching bad data from being recorded, entering a value with a few extra 0’s could be recognized and easily corrected before it finds a home in your dataset.
An example of proactive validation in brewery analytics is setting target tolerances for critical brew specs. Setting traffic light styling of green, yellow, and red can alert users to values that fall outside of the acceptable range for the brand. A system like Beer30 can tell the brewer if a threshold is or is not being hit real-time while brewing—resulting in adjustments to the recipe, to ensure targets and yields will be hit.

P1 - Proactive Validation: Set Target Tolerances for each critical brewing spec.
P2 - PREDICTIVE ANALYSIS
Predicting how key parameters such as gravities and pH will line up for different batch numbers for the same beer is key to profitability. The analysis aspect is to look at these parameters with visualization tools and make meaningful insights on how to stay consistent.
Here is a prime example. A customer noticed their flagship brand had slight inconsistencies and flavor variations between batches. To investigate the issue they started graphing fermentation metrics of each recent batch. They discovered that even though their gravities were very tight and consistent, their pH had a pretty far spread.
The solution for these wide variations was to calibrate pH meters daily, and also adjust adjunct additions during brewing if specs were not lining up during the brew day.
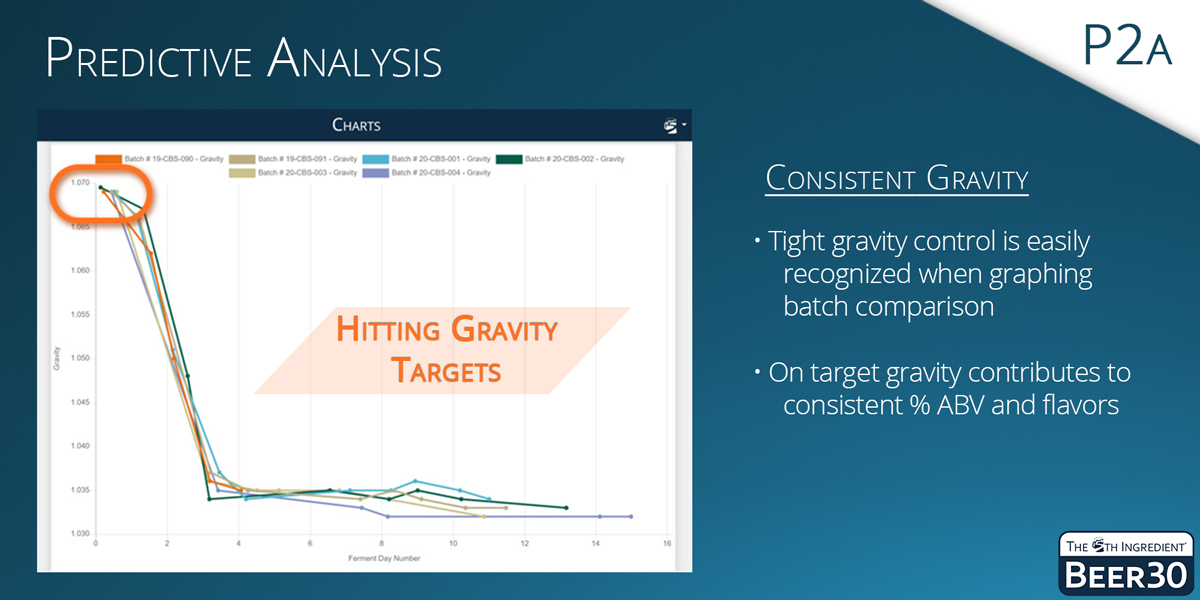
P2A - Predictive Analysis: Tight gravity control contributes to consistent ABV and flavors.
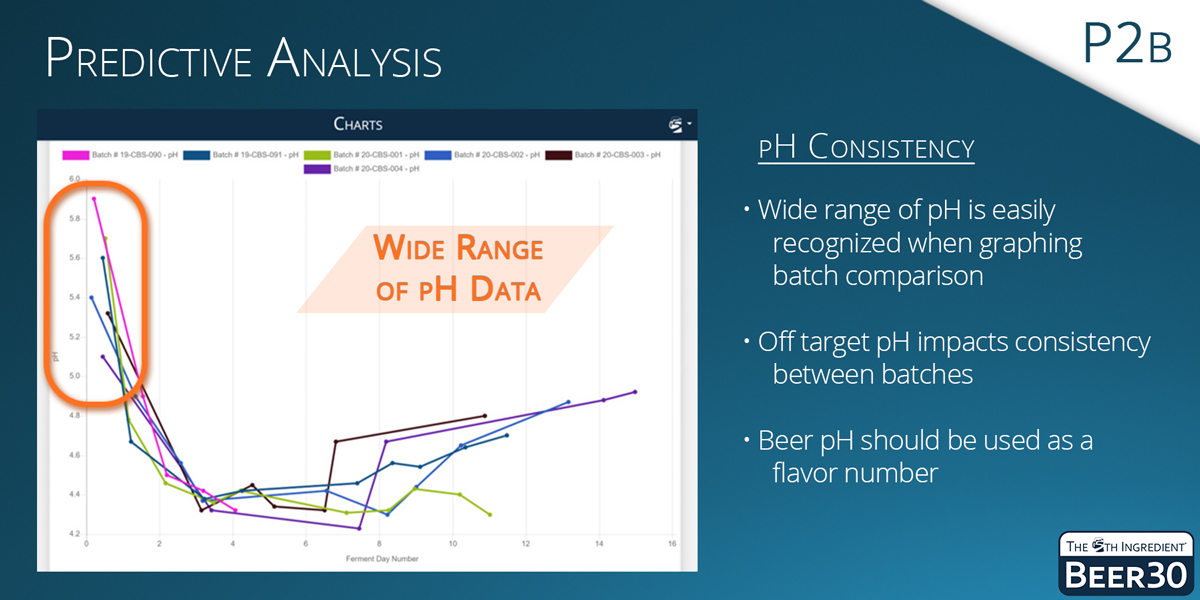
P2B - Predictive Analysis: Off-target pH impacts consistency between batches, and wide-ranging data can be displayed by graphing.
P3 - PROCESS IMPROVEMENT
Stated simply, process improvement is increasing brewery efficiency. Increasing brewery efficiency means less wasted product, more revenue, and more profit per unit. By breaking down the brewing process from grain to glass, every step can be analyzed individually to identify where your brewery can improve and then track those improvements over time.
Given that profitability is the ultimate driver of a successful business, measuring process improvement requires an understanding of the cost for each batch. These costs commonly tie in with raw materials such as grains, hops, and adjuncts, and can also include additions like yeast and package supplies.
More advanced algorithms could include additional components like fixed costs or tank utilization costs. As you start looking at transfers, filters, and merges, the true dollar value per barrel of beer becomes apparent.
Using averages for process improvements is a common pitfall. Instead, brewers should use actual lot numbers and true landed costs to understand how to improve the cost per beer. In the example below, we are tracking actual raw material costs to determine that the cost to brew this particular batch of Indian Brown Sugar Ale is $102.66/BBL. With this information, a successful brewery can ensure that they’re maintaining appropriate costs across batches, compare against other brands, price new products appropriately, and track margins as input prices vary over time.
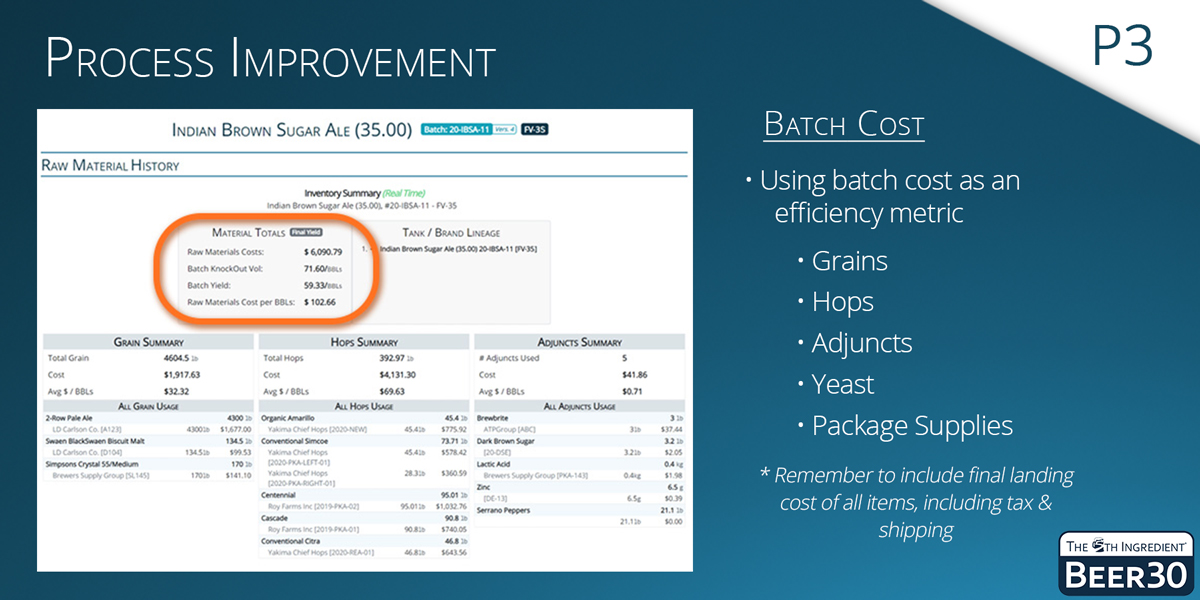
P3 - Process Improvement: Use batch cost as an efficiency metric to understand how much it cost to brew per BBL or HL.
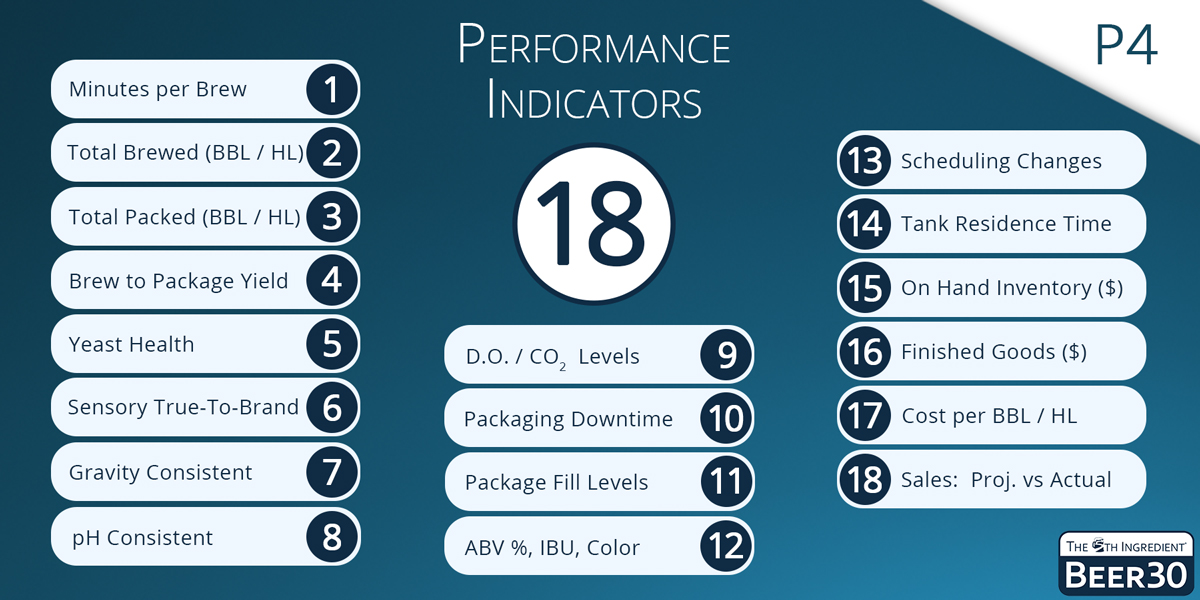
P4 - PERFORMANCE INDICATORS
Performance indicators are key data points for benchmarking your brewery against itself over time and industry standards as a whole. Collecting, aggregating and analyzing these data points allows you to ensure your employees are meeting their production goals on a weekly basis, and are consistently following best practices.
Below are 18 key metrics for brewery analytics that we have shared with our customers—spanning brew, ferment, yeast, quality, packaging, scheduling, inventory, and sales.
The data being recorded on a daily basis should be entered into a software system to streamline the tracking of these areas and help you understand how to keep improving your team’s efficiency and success. The data entered can then be aggregated for weekly metrics and scorecards, and if you start deviating from the baselines, you can identify potential causes and create a game plan to correct the issue.
P4 - Performance Indicators: Set up weekly meetings to assess key performance indicators for your brewery.
Brewery Analytics - The Bottom Line
Now that you are armed with a greater understanding of brewery analytics, we hope you take what we’ve shared and implement (or improve) the proper tools at your brewery.
Instead of making decisions based on anecdotal evidence, where you are forced to rely on your gut, a data-driven approach at a brewery will result in a systematic analysis for concrete conclusions on areas that need improvement at your brewery. The best route for data management comes down to the 4Ps: Proactive Validation, Predictive Analysis, Process Improvement, Performance Indicators.
These operational cornerstones were the catalyst for the founding of The 5th Ingredient. With years of experience in the brewing industry, we recognized the brewing process needed a more dynamic solution than traditional paper logs and spreadsheets.
From there, Beer30 (our software platform) was born. Right from the beginning, our product roadmap has been forged through collaboration with our customers—and by providing breweries with the software features most important to them.
We are in a constant state of growth and improvement, and will always provide the brewery analytics tools that matter most for our customers’ success.
Software systems such as Beer30 are designed to help a brewery succeed in proper data management. As John Reynolds, founding partner at Slow Pour Brewing Company says about Beer30, “We operated for a year and a half without the software, and I wish we had purchased this a lot sooner.”
Beer30, by The 5th Ingredient—reach out today for a demo on how Beer30 can help you brew better beer, with improved brewery analytics and transformed data into cost savings.”
By using a systematic plan to implement the 4Ps of successful data management, you can help your brewery be more efficient and profitable. If you have more questions regarding brewery analytics, or are interested to learn about using the Beer30 software to #BrewMoreBeer and #BrewBetterBeer, visit www.The5thIngredient.com where you can find more information, contact us, or request a demo. You can also drop us a note at pint@the5thingredient.com.
Cheers and beers!