
BrewMonitor® offers your brewing team access to insight that has never been available before: high-resolution data from inside your fermentation tank, allowing you to track the progress of your fermentation, analyze results, benchmark future batches, and much more. The data curves below are from actual, completed fermentations, and they offer a clear view into how yeast issues express themselves as measured data trends.
Unhealthy Yeast
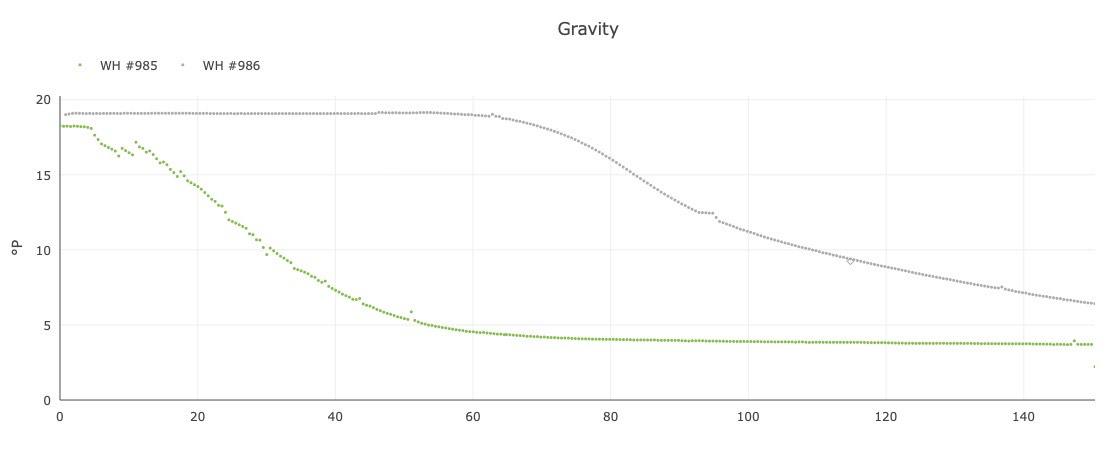
Figure 1
The graphs above (Figure 1) show two fermentation batches of the same beer. Both show gravity readings taken every 30 minutes for 150 hours, starting from the initial pitch of yeast. In green, the healthy fermentation begins within about five hours of the pitch. For the subsequent batch in gray, no discernable fermentation activity begins until around 60 hours after the initial pitch. In this second case, brewers used the BrewMonitor® system to confirm the lack of activity, indicating the relatively poor health of the yeast. They recovered the batch by injecting a fresh pitch of yeast at 50 hours.
Also notable are the relative readings on dissolved oxygen (Figure 2) and pH (Figure 3), shown below. In both cases, the stalled fermentation shows slow or no rates of change relative to the healthy fermentation. With oxygen readings, it’s clear that the brewer aerated the wort as they injected fresh yeast at around Hour 50 for the data in gray. On the pH graph, notice the distinct lack of movement until after Hour 50, when the fresh yeast is added.

Figure 2

Figure 3
A pitch of healthy, vital yeast would begin to change their environment as soon as they hit fresh wort. This can be seen clearly in the third-generation pitch (“3rd gen”), where the yeast acidify the wort and consume oxygen within minutes of pitch time. (Note: The X-axis origin is time of pitch as reported by the brewer.) One can therefore conclude that the yeast crop underwent too much stress between its third and fourth pitch to maintain enough vitality to ferment another high-gravity beer.
Underpitching
Sensory issues also can arise during fermentation in ways that are detectable when monitoring with high-frequency data streams. For example, the graph below (Figure 4) shows three sequential batches of the same beer, brewed in series by a brewery that used the BrewMonitor® system to track their progress.

Figure 4
Notice how the gravity readings align, with Batch 96 only about a tenth of a degree Plato above the other two fermentations. In fact, it was Batch 95 that expressed a notable sensory issue, with an ester profile that pushed into a notable “nail-polish remover” quality. While these gravity graphs are so closely aligned that they don’t betray enough variation from No. 95 to the other two, the pH readings (Figure 5) show a marked difference:

Figure 5
Here, the pH for No. 95 drops below the other two batches sometime shortly after Hour 30. It remains lower for the duration of fermentation, never recovering back to the same relative measures of the other two batches. This indicates an increase in the acidification of the wort caused by the yeast.
After each of these batches were finished, the brewery conducted a sensory evaluation. Once the significant variation in the ester profile for Batch 95 was noted, the brewery was able to use the pH and gravity data seen here to confirm that the yeast had behaved errantly. By comparing this data with their cell viability data, they were able to pinpoint the cause of the issue to a slight underpitch (one that would have otherwise been considered within an acceptable margin of error without this data to support). This data gave them the edge they needed to be confident in adjusting their standard operating procedures and margins of error for their yeast re-harvesting process.
Continuous Fermentation Monitoring
The BrewMonitor® system attaches to your existing fermentation tank and continually monitors:
- dissolved Oxygen
- pH
- gravity
- pressure
- fluid temperature
- ambient temperature
- conductivity
With about 1,000 data points per day, automatic alerts, and never-before-seen fermentation insights, brewers can gain new control over their process, product, profit, and labor.
Have questions? Want to know more about how you can implement continuous monitoring in your brewery? Contact Us.